Many states are not getting good value for their health care dollars

29%

of adults with job-based insurance received unneeded lower back imaging at diagnosis

Quality of care is not in line with the level of state health spending

Health care spending in the United States is much greater than in other wealthy countries, but U.S. health outcomes are not better.13

Our analysis finds that for every state, health spending exceeds median per capita spending in each of 10 other high-income countries.14 In general, research shows that higher spending in the U.S. is attributable to higher prices.15

Here are just a few examples of gaps in quality across the U.S.:

  • Among working-age adults with employer-sponsored insurance, nearly one in three (29%) who were newly diagnosed with lower back pain in 2015 received potentially inappropriate medical imaging. That means the scans these patients received are not associated with improved outcomes when there is no underlying condition; some tests would expose them to unnecessary radiation.16
  • One in three adults were not up to date on recommended cancer screenings in 2016. Even in the best-performing state, the shortfall was 24 percent. As many as 40 percent of adults in Idaho, New Mexico, Oklahoma, and Wyoming did not get these screenings.
  • Even when they have insurance coverage, Americans visit the emergency department (ED) for nonemergency care at high rates. Similarly high rates among Medicare- and employer-insured adults suggest there may be factors other than coverage or age, such as inadequate access to primary care, driving the behavior.

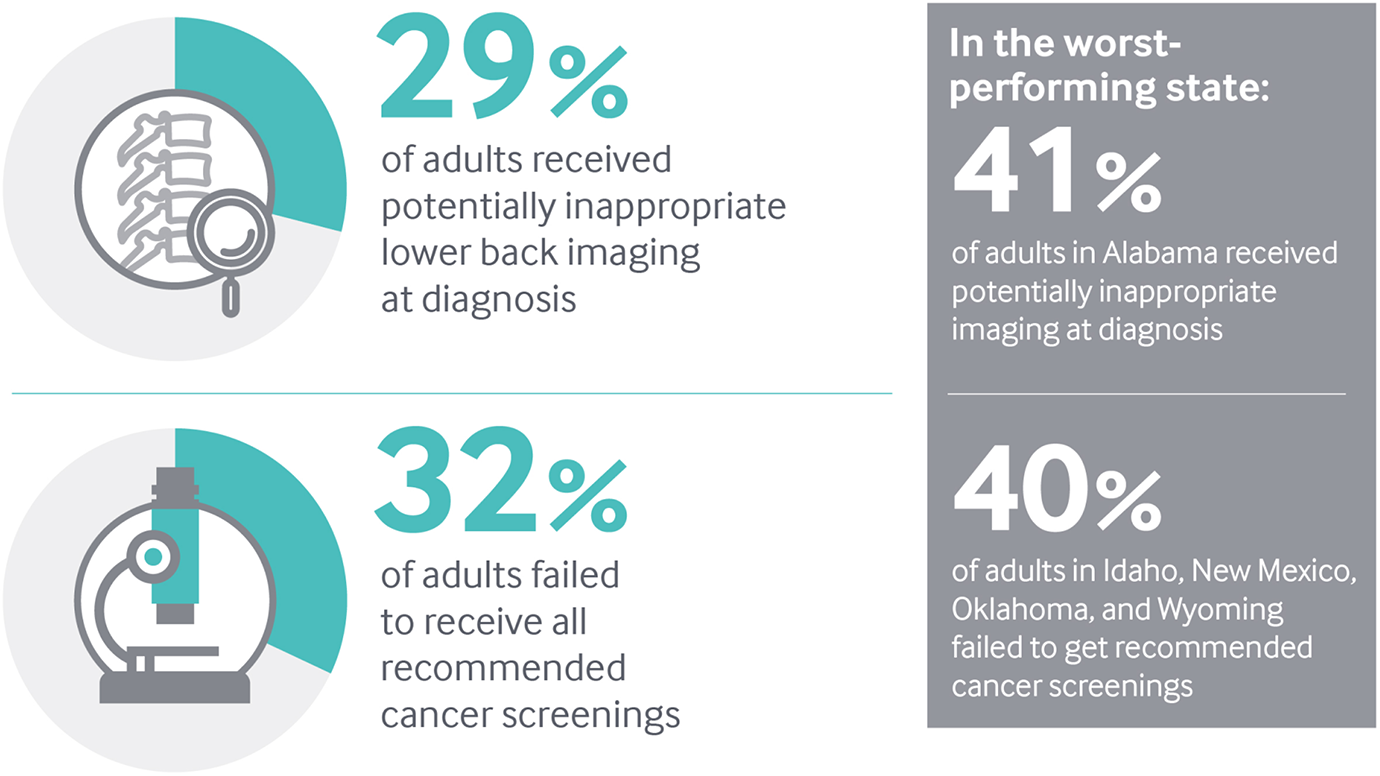
Note: Lower back pain imaging is measured among newly diagnosed working-age patients ages 18–50 with employer-sponsored insurance.

Data: Lower back imaging, 2015 Truven MarketScan Database, analysis by M. Chernew, Harvard University; Cancer screenings, 2016 Behavioral Risk Factor Surveillance System (BRFSS).


Mixed findings on health care spending

The average amount Medicare spends on care for each beneficiary has leveled off in recent years across all states.

Spending per enrollee in employer-sponsored insurance plans was nearly flat nationally from 2013 to 2015. However, 18 states saw increases of at least $300 per enrollee during this time, or 5 percent on average — more than twice the rate of general inflation.17 These data do not include prescription drug costs, which have been rising rapidly in recent years. Both across states and within individual states, there is often no consistent relationship between health care spending by Medicare and by employer-sponsored insurance.18

What Can Be Done?

Efforts to control health care costs must be tailored to reflect the unique characteristics of each market.19

Greater pricing transparency, coupled with value-based benefit design and payment approaches, could encourage better-informed choices and movement toward higher-value health services and providers.20 Evidence from states and from countries around the world show that health systems with a strong primary care orientation generally achieve better health outcomes at lower cost.21 Making primary care more accessible and patient-centered also can help reduce use of the ED for conditions that could be treated in primary care settings.22

What Are States Doing?

Several states participate in initiatives involving both public and private insurers to foster the transformation of primary care practices into patient-centered medical homes, which can improve patient care and reduce costs.23

State and federal partnerships to integrate care for Medicare and Medicaid beneficiaries aim to reduce hospitalizations and ED use among patients with complex care needs while improving their quality of life.24 In Rhode Island, health plans are required to measure and increase the proportion of health care spending devoted to primary care, without increasing medical costs or premiums.25

Conclusion
  1. Eric C. Schneider et al., Mirror, Mirror 2017: International Comparison Reflects Flaws and Opportunities for Better U.S. Health Care (The Commonwealth Fund, July 2017), http://www.commonwealthfund.org/interactives/2017/july/mirror-mirror/.
  2. Centers for Medicare and Medicaid Services, Health Expenditures by State of Residence, 1991–2014 (CMS, n.d.), https://www.cms.gov/Research-Statistics-Data-and-Systems/Statistics-Trends-and-Reports/NationalHealthExpendData/NationalHealthAccountsStateHealthAccountsResidence.html.
  3. Austin Frakt and Aaron E. Carroll, “Why the U.S. Spends So Much More Than Other Nations on Health Care,” The Upshot (blog), New York Times, Jan. 2, 2018, https://www.nytimes.com/2018/01/02/upshot/us-health-care-expensive-country-comparison.html; and Joseph L. Dieleman et al., “Factors Associated with Increases in U.S. Health Care Spending, 1996–2013,” JAMA 318, no. 17 (Nov. 7, 2017): 1668–78, https://jamanetwork.com/journals/jama/article-abstract/2661579.
  4. The measure specification excludes patients with underlying conditions for which imaging may be appropriate, to the degree these conditions are captured in claims data; see National Quality Measures Clearinghouse, Measure Summary: Use of Imaging Studies for Low Back Pain: Percentage of Members with a Primary Diagnosis of Low Back Pain Who Did Not Have an Imaging Study (Plain X-ray, MRI, CT Scan) Within 28 Days of the Diagnosis (Agency for Healthcare Research and Quality, 2016), https://www.qualitymeasures.ahrq.gov/summaries/summary/49748 (site discontinued as of July 17, 2018).
  5. Bureau of Labor Statistics, Consumer Price Index (U.S. Department of Labor, 2018), https://data.bls.gov.
  6. Kevin Quealy and Margot Sanger-Katz, “The Experts Were Wrong About the Best Places for Better and Cheaper Health Care,” The Upshot (blog), New York Times, Dec. 15, 2015, https://www.nytimes.com/interactive/2015/12/15/upshot/the-best-places-for-better-cheaper-health-care-arent-what-experts-thought.html; and Zack Cooper et al., The Price Ain’t Right? Hospital Prices and Health Spending on the Privately Insured, NBER Working Paper No. 21815 (National Bureau of Economic Research, Dec. 2015), https://www.nber.org/papers/w21815.
  7. Dominique Hall and Mark A. Zezza, “McAllen, Texas: Tailored Solutions to High Spending Are Needed,” To the Point (blog), The Commonwealth Fund, May 5, 2015, http://www.commonwealthfund.org/publications/blog/2015/may/mcallen-texas-health-spending.
  8. Anna D. Sinaiko, Karen E. Joynt, and Meredith B. Rosenthal, “Association Between Viewing Health Care Price Information and Choice of Health Care Facility,” JAMA Internal Medicine 176, no. 12 (Dec. 1, 2016): 1868–70, https://jamanetwork.com/journals/jamainternalmedicine/fullarticle/2571612; Suzanne F. Delbanco et al., Benefit Designs: How They Work (Urban Institute and the Catalyst for Payment Reform, Apr. 2016), https://www.urban.org/research/publication/benefit-designs-how-they-work; Mark B. McClellan et al., Payment Reform for Better Value and Medical Innovation: A Vital Direction for Health and Health Care (National Academy of Medicine, Mar. 2017), https://nam.edu/wp-content/uploads/2017/03/Payment-Reform-for-Better-Value-and-Medical-Innovation.pdf; and Zirui Song et al., “Changes in Health Care Spending and Quality 4 Years into Global Payment,” New England Journal of Medicine 371, no. 18 (Oct. 30, 2014): 1704–14, http://www.nejm.org/doi/10.1056/NEJMsa1404026.
  9. Barbara Starfield, Leiyu Shi, and James Macinko, “Contribution of Primary Care to Health Systems and Health,” Milbank Quarterly 83, no. 3 (2005): 457–502, http://www.commonwealthfund.org/usr_doc/Starfield_Milbank.pdf; and Mark W. Friedberg, Peter S. Hussey, and Eric C. Schneider, “Primary Care: A Critical Review of the Evidence on Quality and Costs of Health Care,” Health Affairs 29, no. 5 (May 2010): 766–72, https://www.healthaffairs.org/doi/abs/10.1377/hlthaff.2010.0025.
  10. Cathy Schoen et al., “Access, Affordability, and Insurance Complexity Are Often Worse in the United States Compared to Ten Other Countries,” Health Affairs 32, no. 12 (Dec. 2013): 2205–15, http://www.commonwealthfund.org/publications/in-the-literature/2013/nov/access-affordability-and-insurance; and John Billings, Nina Parikh, and Tod Mijanovich, Emergency Department Use in New York City: A Substitute for Primary Care? (The Commonwealth Fund, March 2000), http://www.commonwealthfund.org/publications/issue-briefs/2000/mar/emergency-department-use-in-new-york-city--a-substitute-for-primary-care.
  11. Marci Nielsen et al., The Patient-Centered Medical Home’s Impact on Cost and Quality: Annual Review of Evidence, 2014–2015 (Patient-Centered Primary Care Collaborative, Feb. 2016), https://www.pcpcc.org/resource/patient-centered-medical-homes-impact-cost-and-quality-2014-2015; and Amanda R. Markovitz et al., “Patient-Centered Medical Home Implementation and Use of Preventive Services,” JAMA Internal Medicine 175, no. 4 (Apr. 2015): 598–606, https://jamanetwork.com/journals/jamainternalmedicine/fullarticle/2110999.
  12. Sarah Klein, Martha Hostetter, and Douglas McCarthy, The “One Care” Program at Commonwealth Care Alliance: Partnering with Medicare and Medicaid to Improve Care for Nonelderly Dual Eligibles (The Commonwealth Fund, Dec. 2016), http://www.commonwealthfund.org/publications/case-studies/2016/dec/commonwealth-care-alliance; and Alexandra Kruse, Stephanie Gibbs, and Leah Smith, Advancing Medicare and Medicaid Integration: Key Program Features and Factors Driving State Investment (Center for Health Care Strategies, Nov. 2017), https://www.chcs.org/resource/advancing-medicare-medicaid-integration-key-program-features-factors-driving-state-investment.
  13. Christopher F. Koller and Dhruv Khullar, “Primary Care Spending Rate — A Lever for Encouraging Investment in Primary Care,” New England Journal of Medicine 377, no. 18 (Nov. 2, 2017): 1709–11, http://www.nejm.org/doi/10.1056/NEJMp1709538; and Office of the Health Insurance Commissioner, Primary Care Spending in Rhode Island: Commercial Health Insurer Compliance (State of Rhode Island, Jan. 2014), http://www.ohic.ri.gov/documents/Primary-Care-Spending-generalprimary-care-Jan-2014.pdf.